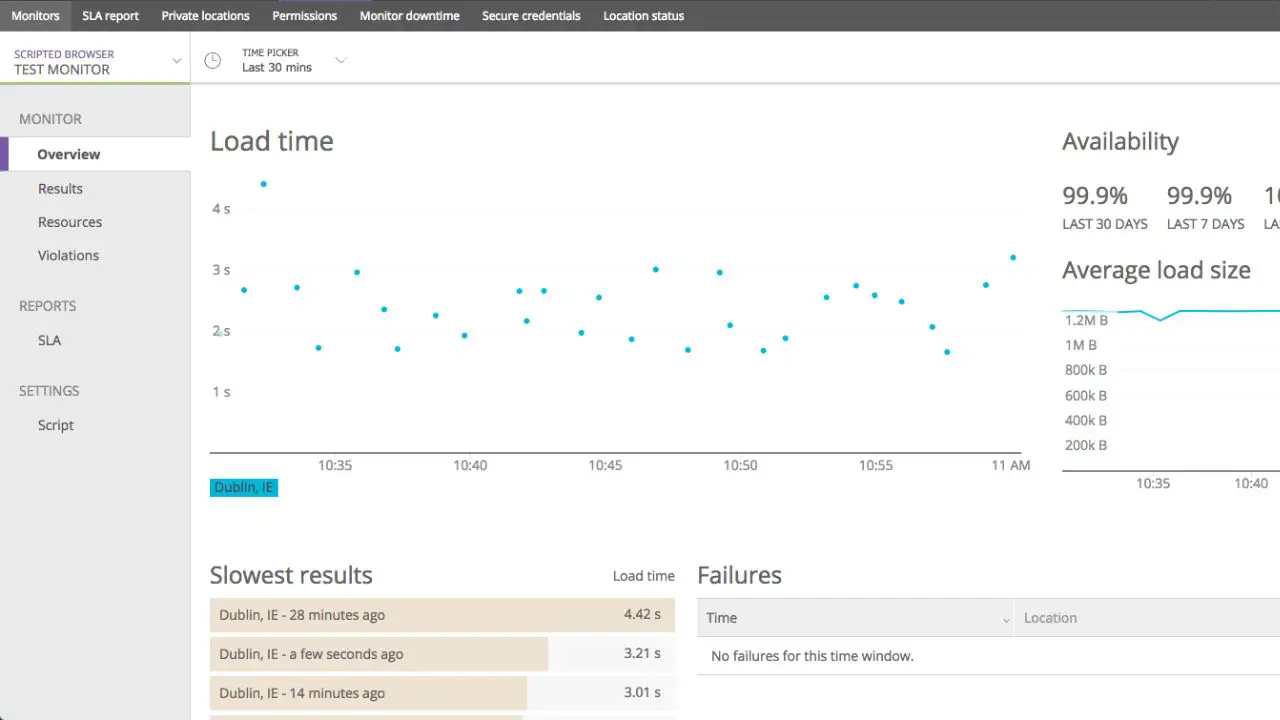
To get Synthetics monitoring to work in New Relic, you need to sign into your New Relic account. Then, get the page that you want to test, copy the URL, and paste it into the selected box. Now, you can view the Synthetics summary page for all the data through the one.newrelic.com website.
Synthetics monitoring is the process of utilizing software that can stimulate user interaction with a system. You can later on analyze and evaluate the data retrieved from the stimulated transaction. This also helps to understand how the system behaves. This type of monitoring does not require any actual traffic, and so it is named Synthetics Monitoring.
This type of monitoring is used by companies to test new applications before they become LIVE. It also has the capability to work on internal applications and behind firewalls. You can set up a private location and deploy the type of Synthetics monitor you want to create in a secure context.
Let’s get to know more about how to get Synthetics Monitoring to work in New Relic.
Types of Synthetics Monitoring
There are three types of Synthetics Monitoring:
- Availability monitoring
- web performance monitoring
- Transaction monitoring
How to set up Synthetics monitoring with New Relic?
Synthetics Monitoring can perform scriptable checks on customers facing internal app problems. So, you can set up synthetic monitors to fix problems that are more critical, and a ping monitor would fail to cope with this.
You get to expand your browsing monitor with real scripted browsers where you can test login procedures and searches and track business transactions. Run the API test and check the certificate or any kind of HTTP request.
You can extend the coverage by using additional Mode modules which are made for scripted API monitors. Also, you can easily diagnose the issue from the network or AWS location of third-party resources.
However, before you proceed to get Synthetics Monitoring, you must create a free New Relic account. You also need to check whether the Synthetics Monitoring is compatible with the supported browser.
Now, based on the type of monitor, you can add or edit monitors. Use synthetics REST API to manage monitor and set up monitor from private locations or servers. You will also get to use the Host Not Reporting feature in infrastructure monitoring.
So, this proves to be beneficial as you will get a notification that New Relic has stopped receiving data from your host. If you have any application that you need to maintain and keep it LIVE, then Synthetics Monitoring helps to check the page load performance.
Step-by-Step Process
- First, you need to sign into your New Relic account.
- Now, once you have signed in, go to one.newrelic.com, navigate to Synthetics Monitoring, and tap on the option Create a monitor.
- Next, choose the Page Load Performance tile
- Next, you have to get the URL for the page that you want to test.
- Copy the URL and put it in the URL check space. The best way to do this is to select at least three locations where your monitor deploys.
- This will also help you to eliminate the chances of false positives.
- On your check, you can also adjust the time period between checks and the Period dropdown list.
- You need to view the data as soon as the monitor reports. So, go to the Synthetics summary page through the one.newrelic.com. Navigate to Synthetics Monitoring.
- Finally, you need to select the particular monitor, and the summary page will be displayed.
How can you work with Cordless monitoring?
Try out cordless monitoring, and it’s quite easy to create cordless monitoring through common user workflow. It will help to mimic simple behavior, like testing page elements, submitting text into a text field, navigating across different pages, etc.
To process – you need to sign into your new account, and for that, click on one.newrelic.com. Now, navigate to Synthetics Monitoring, and click on the option ‘Create a monitor’. Next, you can choose the ‘User Step execution’ tile.
Now, to create a monitor, you have to give a name and also choose the duration for which the monitor will be running. Next, select the location from where the monitor will deploy.
You need to go through one.newrelic.com and then click on Synthetics Monitoring. Next, click on ‘Create a monitor’ and choose the ‘Users setup execution’ option.
How to define your steps?
You need to define the steps or test how the journey looks like:
First, the customer will go to the web app, and in the page model, they will type the email.
Select the option from the dropdown menu, and then it will take them to a different page.
After selection, you can also select items to purchase, fill out forms, pay through a secure gateway, secure credentials, and more. So, whatever be your choice, you must click on ‘Validate’ to save your monitor. It will also ensure that the steps that you have validated will run successfully.
Check your data when your monitor starts reporting. You can check the data on the Synthetics summary page. So, go to onenewrelic.com, select the monitor model that you are using, and click on the Summary page.
What is the function of scripted monitoring?
Script monitors are quite flexible in terms of use and allow you to test website behavior. It also helps you to respond to pages, such as choosing different paths across your website, depending on the conditions of scripted customers, etc.
You need to create a scripted browser only if you want to define customer timeout values, want the script actions that aren’t provided in the step builder, or want to set up conditions to change the path that your monitor takes.


