Stress testing examines a system’s, network’s, or application’s behavior under extreme stress. It also decides whether the system can recover while returning to its previous state.
The fundamental goal of stress testing is to determine if a system, software, device, or network can be recovered.
This article will assist you in choosing the best stress testing instrument for your needs. The tool you choose depends on the sort of testing you want to do, such as stress testing for your PC, CPU stress testing, RAM stress testing, or GPU stress testing.
CPU stress testing is used to evaluate the performance of a processor after it has been run at maximum speed and temperature. All of the cores in a multi-core machine will be utilized during CPU stress testing. The CPU will be put to the test with a workload that is both compatible and justifiable.
Best CPU Stress Test Tools
1. AIDA64
AIDA64 is a professional-level system diagnostic tool. It has a lot of interesting capabilities and can stress test any PC component, including the GPU, CPU, and RAM.
AIDA64 can identify phony NVIDIA graphics cards by looking for counterfeit PCI IDs and reflashed BIOS images. On RGB devices, it also has a sophisticated RGB LED module for CPU and memory temperatures, usage, voltages, fan speeds, and network traffic.
Features
Diagnostics
AIDA64 has more than about settings.
Stress testing
The 64-bit multi-threaded stress testing module in AIDA64 System Stability Test is used to push the machine to its ultimate limits. Stress testing for hard discs, SSDs, and OpenCL GPGPU video adapters are also provided.
Accuracy
AIDA64 offers the most precise hardware identification capabilities in its class, allowing it to deliver extensive information on the internals of a computer without having to open it up. An extensive hardware database with over 200,000 items supports the hardware detection module.
Benchmarking
AIDA64 Extreme’s benchmark pages offer a variety of ways to assess system performance. Because these benchmarks are synthetic, the results only reflect the system’s theoretical (maximum) performance.
The CPU of the AIDA64 Extreme is based on the multi-threaded AIDA64 Benchmark Engine, which can handle up to 1280 processing threads at the same time. It also supports systems with multiple processors, multiple cores, and HyperThreading.
Software Audit
There is also a list of initiated processes, services, DLL files, starting applications, and visited web pages.
External Display Support
On a variety of LCD/VFD devices connected to the computer, AIDA64 may show critical system statistics. The current AIDA64 update adds wireless remote monitoring of sensor data on smartphones and tablets, as well as support for over 50 LCD and VFD displays.
Measurements
AIDA64 can detect temperatures, voltages, fan speeds, and power drain from over 250 different sensor devices.
2. OCCT
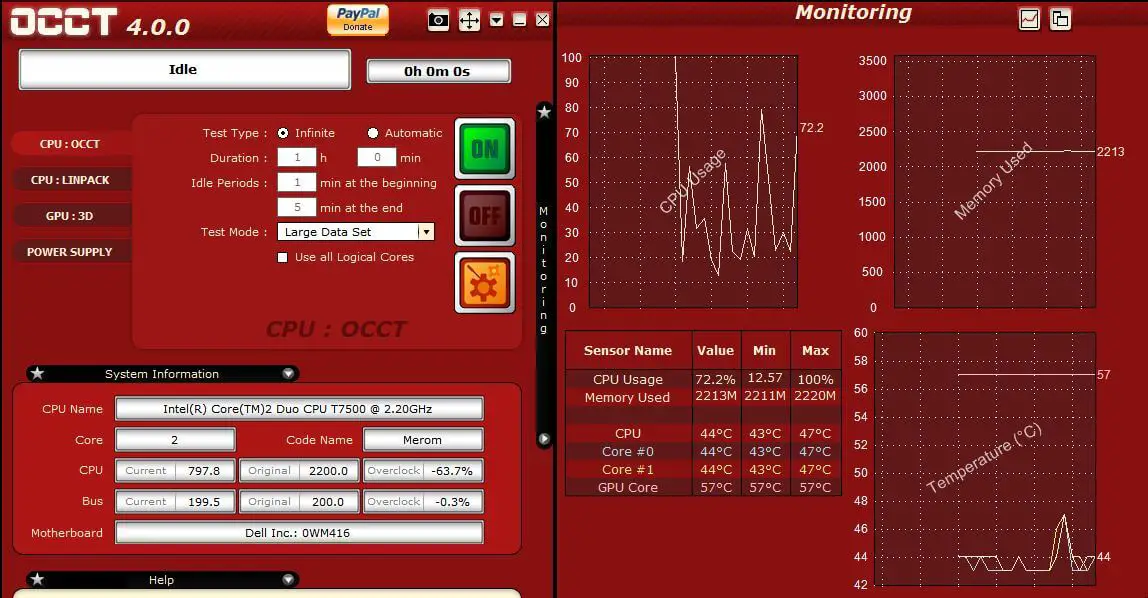
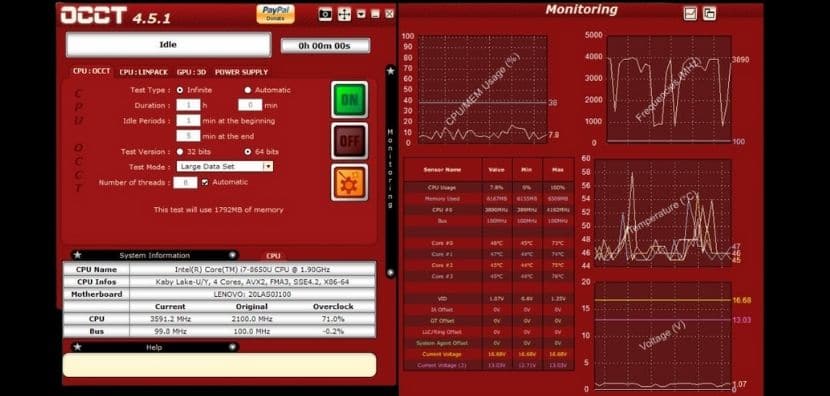
One of the greatest tools for stress testing the CPU and other hardware components is OCCT. It’s geared toward experts, but anybody with a thorough grasp of PC components may benefit from it. OCCT allows you to conduct a series of intensive tests on your CPU to ensure that all cores are being utilized to their maximum potential. Aside from that, it detects hardware flaws when a component fails to operate as intended. The best thing about OCCT is that it has a monitoring engine that shows you your CPU’s temperature, voltages, fan speed, frequencies, and other information. The data is supported by clear graphics to help you understand the details. Overall, OCCT is a one-stop solution for stress testing your CPU and checking for hardware problems. Even better, if you use it on your own computer, the application is absolutely free.
OCCT With Four Options
OCCT has a pretty difficult CPU stress test that is frequently neglected. Although it does not create the huge quantities of heat as AVX does under Prime95, it is still an excellent candidate for lengthy stability testing. The program may record a variety of critical parameters, either indefinitely or after a set period of time.
OCCT With Small Data Set
However, we may assert that it is more memory intensive than Prime95.
OCCT With Big Data Set
The overall load decreases once again, making this test ideal for computers that need not be overheated.
Memory, in particular, is pushed to its limits in a way that we haven’t seen since Prime95. In fact, this is our suite’s second-most-demanding memory burden.
OCCT With Linpack & AVX
The AVX implementation in OCCT creates a high overall load, albeit it isn’t as high as the Small Data Set option in this tool. The memory load is also still rather high.
OCCT With Linpack & SSE
Similar to the Big Data Set option, OCCT’s SSE implementation delivers a low overall load. However, while it doesn’t break any new records, it’s an excellent option for lower-end PCs with stock cooling. It’s also an excellent choice for long-term testing.
3. 3DMark
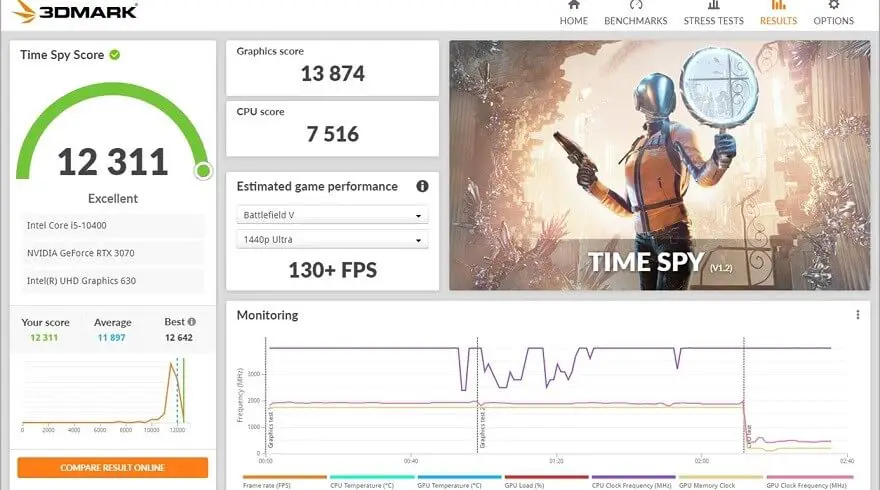
With the addition of a dedicated stress testing tool to 3DMark, we’ve made it easier than ever to verify the stability of your PC. The goal of stress testing is to provide a heavy load on your system for a lengthy period of time in order to reveal any stability or reliability issues. It can also assist in the detection of defective hardware or the need for improved cooling.
After buying or constructing a new PC, updating your graphics card, or overclocking your GPU, the optimum time to perform a 3DMark Stress Test is right thereafter. During the test, if your GPU crashes or exhibits visual abnormalities, it might indicate an issue with dependability or stability. If it overheats and shuts off, your computer may require more cooling.
System builders, gamers, and overclockers will benefit from 3DMark, a sophisticated benchmarking program. It may be used to assess the CPU workload processing and 3D graphics rendering capabilities of a variety of devices, ranging from laptops and tablets to the newest 4K gaming PCs.
It automatically examines your hardware and recommends a benchmark that is appropriate for your system. The test displays GPU and CPU temperature, frame rate, and clock speeds in real-time after you start it. It also compares your smartphone to similar models to determine whether it’s time to update.
4. Prime95
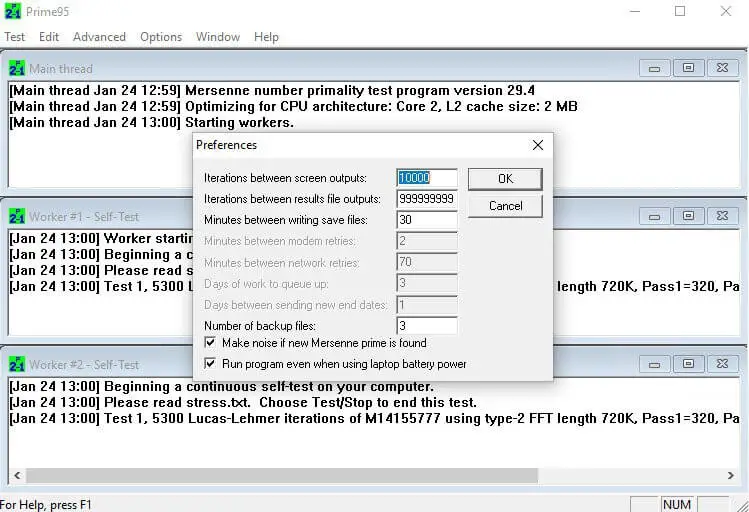
Prime95 is one of the most well-known CPU stress testing programs. It implements two algorithms: Lucas-Lehmer and Probable prime, which throttle the CPU to discover Mersenne prime (2n 1). If your system can execute this program for 6 hours straight (without interruptions or glitches), it is less likely to encounter problems over its useful lifespan.
Prime95 has a ‘Torture Test’ mode that is designed to find faults in PC subsystems. By adjusting the scale of the Fast Fourier transform, you may tailor the program to better evaluate different components of your system.
You may test the CPU’s caches and floating-point unit with the small mode setting. You may, however, use the ‘blend’ mode configuration to test everything (even RAM). If the number of processor threads is more than 64 in the Windows 64-bit version, Prime95 does not fully stress all of them. In this instance, the operating system will divide the processors into groups, each of which can have up to 64 threads.
New Features
- Proofs in PRP format. GIMPS can now double-check a PRP test for less than 1% of the price of a complete PRP test!
- PRP proofs need a large amount of temporary disc space.
- Uploading a big proof file is required for PRP proofs. You can check the details in the readme.txt file.
- Downloading a small verification file is required for PRP proof verifications.
- In 30.2, proofs were automatically uploaded to the server.
- Work preference for first-time LL, world-record LL, and 100M-digit LL is deprecated.
- The new resource restricts the menu options and dialogue box. Before making any changes to these settings, make sure to read the readme.txt file.
- Some settings from the Test/Worker Windows and Options/CPU dialogue boxes have been relocated to the resources dialogue box.
- The work preferences of LL-DC and PRP-DC have been merged into a single choice.
- If your temporary disc space is less than 1.5GB, you may not be able to run prime tests for the first time.
5. PCMark
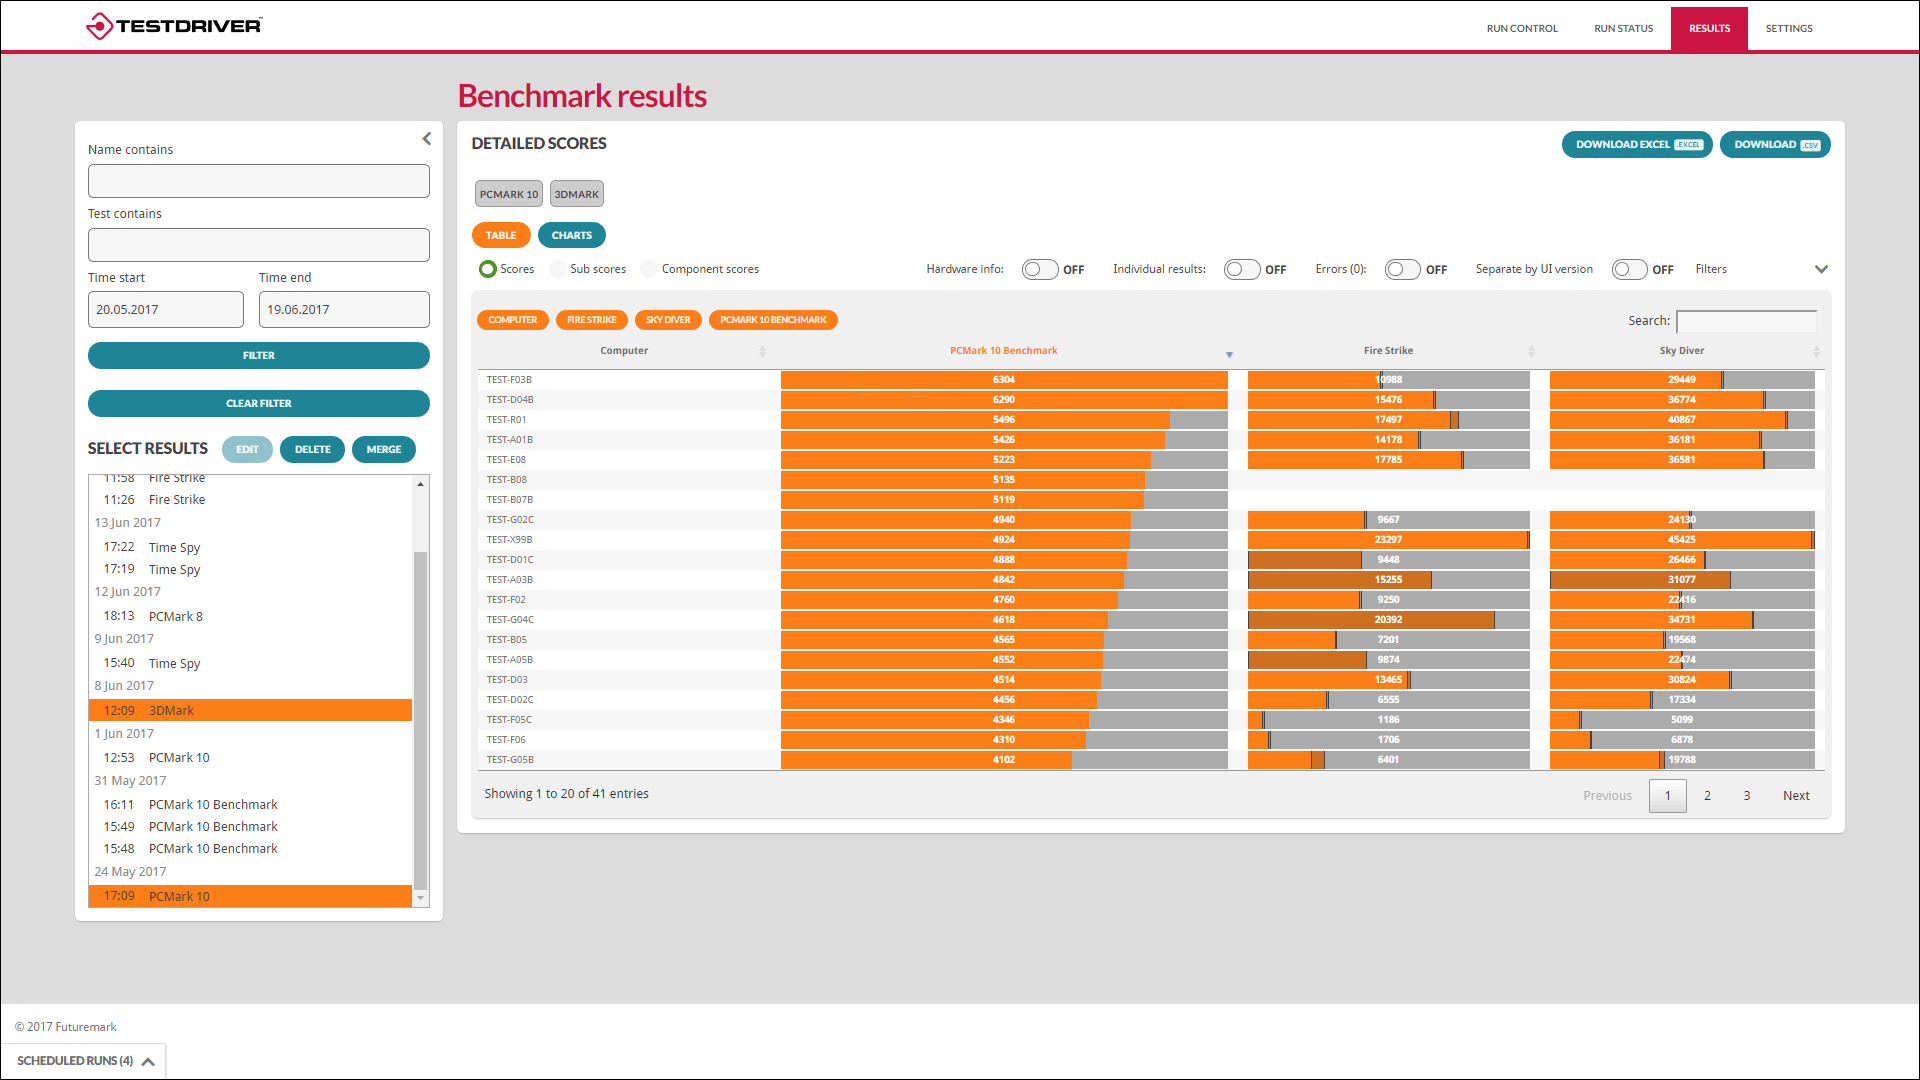
PCMark benchmarks evaluate a system’s performance by running tests that simulate real-world scenarios. Everyday tasks like playing games, editing photographs and videos, and browsing the internet are included in these examinations.
Each benchmark run generates low-level workload, mid-level test group, and high-level benchmark scores, all of which may be compared inside the program. Overall, it’s a good tool for comparing systems and choosing upgrades because it’s factual and fair.
6. Intel Extreme Tuning Utility
This is one of the greatest performance tweaking tools for Intel computers on the market. Overclocking, monitoring, and stress testing the CPU, RAM, and GPU are all possible.
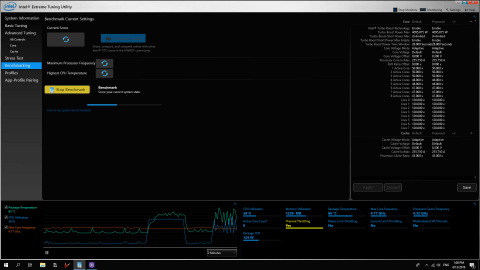
The interface displays a variety of powerful capabilities as well as new Intel Motherboard and Application Processor technologies. Package temperatures, maximum core frequency, CPU utilization, thermal throttling, and power limit throttling may all be monitored using the graph feature.
What is Intel Extreme Tuning Utility (XTU) and how does it work?
Intel’s Extreme Tuning Utility (XTU) is a Windows-based software that allows you to overclock and adjust your system’s performance. Many enthusiasts prefer to adjust core voltage, clock speed multiplier (on compatible CPUs), and turbo boosts power limitations through BIOS, although Intel XTU gives options for doing so as well (if the manufacturer has enabled this option).
Most of us, however, have laptops that aren’t capable of overclocking, both because of the shift Intel processors went through when they switched from a conventional FSB to a BCLK configuration some years ago, and because our cooling systems can’t take that amount of heat. Fortunately, some of the options accessible to us, such as core voltage, may be utilized to minimize the heat burden on our computers as well as overclocking.
To add to Intel’s explanation of overclocking, we’d say Intel XTU is a tool that allows us to tweak settings to decrease the temperatures our system reaches under stress, perhaps quieter fans, and possibly longer battery life. Intel XTU works in a similar way to the third-party ThrottleStop program, which is a popular choice among mobile computing enthusiasts.
If you’re already using ThrottleStop and want to try Intel XTU, you’ll need to undo any customizations, delete ThrottleStop, and reboot your computer before installing Intel XTU. Many of the same registers are modified by both applications, which may make things a little confusing.
Basics
Layout
When you first launch Intel XTU, you’ll see a screen that displays extensive information about your gear, such as the CPU, RAM, and motherboard. This information can be beneficial for those who are attempting to assist with problems via a forum, however, serial numbers should be hidden. They’re unlikely to be useful to anybody, so why take the chance?
The navigation menu is located on the left side of the screen, and it allows you to cycle through the different tasks required for undervolting or overclocking. A line graph and a table at the bottom of the page reveal output data from the hardware and related sensors within your laptop.
Temperature, usage, and throttle state are displayed by default, but the small spanner/wrench symbols allow you to add or remove monitor elements from here to customize the configuration to reflect what’s essential to you.
Panels: Advanced Tuning
We’ll concentrate on the ‘Core’ portion for the purposes of this guide (referring to the CPU cores). Today, we’re simply concerned with two settings: “core voltage offset” and “turbo boost power max.” Setting a static voltage to increase stability when overclocking desktop systems is standard, however, this might degrade battery life on mobile devices. Instead, we’ll modify the offset, which allows the CPU to dynamically adjust the voltage to fit the job at hand, i.e. lower while idle and higher when working hard. This offset works by taking the level to which the CPU would have adjusted and then multiplying it by the offset level.
Several manufacturers lock the turbo boost power max setting, which restricts how many watts the chipset (including GPU) can draw.
Panels: Stress Test
The built-in stress tests aren’t as demanding as fan favorites like Prime95 or AIDA64, but they’ll suffice for our first testing. You may perform the stress test for as long as you like, and each test aims to simulate a full load without causing the workload saturation that the two prior stress tests do. The built-in tests may be used to check stability during the undervolting (or overclocking) process, while Prime95 or AIDA64 can be used to confirm stability once you’ve completed modifying your ‘long-term’ setting.
Panels: Profiles
Intel XTU allows you to build numerous profiles with different modifications that you can rapidly choose between. This function won’t be used by most readers since once you’ve established the greatest steady undervolt your system can tolerate, you’ll operate at that level for months at a time. If you have a CPU that can overclock, you may build an overclocked profile for applications like gaming or video editing, and an undervolted profile for everyday computing to reduce thermals and extend battery life.
Panels: Profile Pairing
Finally, there’s the App->Profile connection. It works by utilizing software or process to automatically switch Intel XTU between pre-set profiles, such as switching from the daily-use ‘undervolt profile’ to the ‘overclocked profile’ when a pre-selected game launches. The pairing works by choosing which profiles to use for AC power and on battery power from a list of running software (or by typing the name of a.exe process or browsing your system for the desired.exe) and then selecting from a list of running software (or by typing the name of a.exe process or browsing your system for the desired.exe). This is a strong feature and the most efficient method to use profiles.
7. HWMonitor
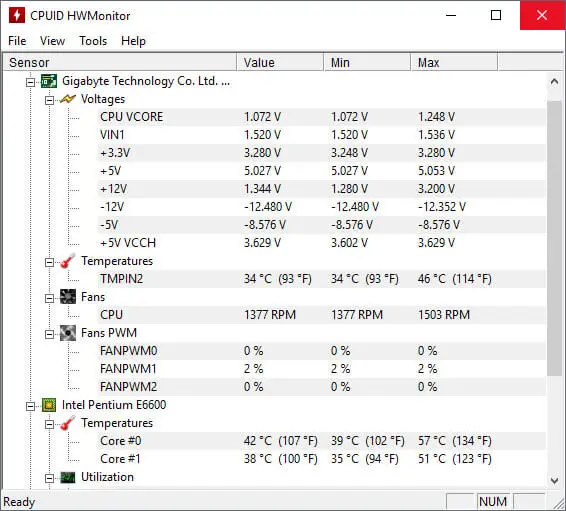
HWMonitor examines your system’s key health sensors and reports on CPU temperature, power consumption, usage, GPU and motherboard voltage, fan speed, and hard disc drive temperature.
The Pro edition allows you to send monitoring data across a local network and see it on another device. You can monitor up to 10 systems from your Android smartphone using the current version.
8. Intel Processor Diagnostic Tool
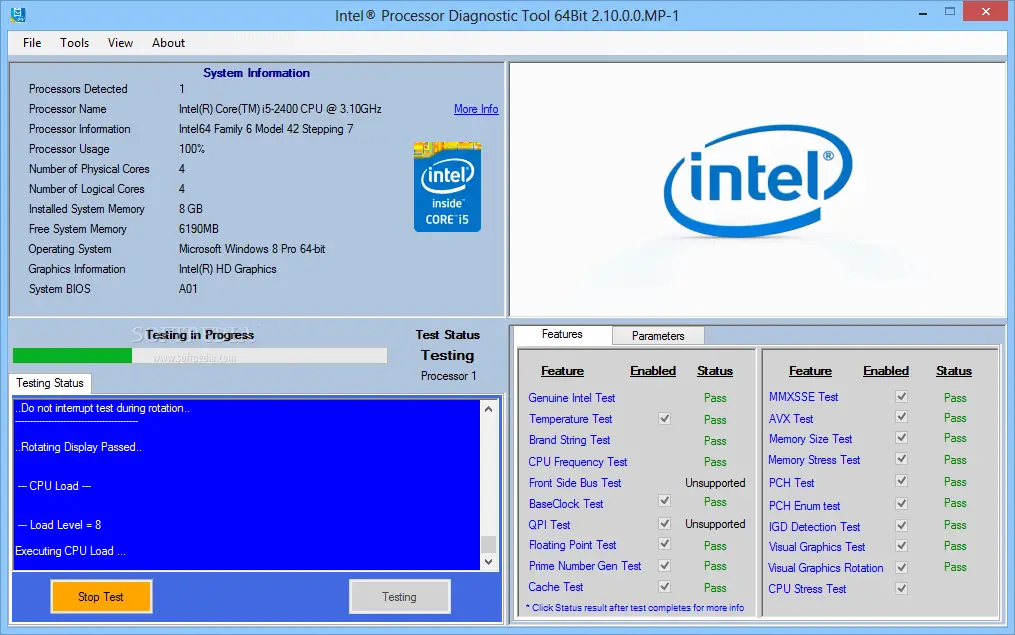
The Intel Processor Diagnostic Tool, as its name indicates, checks for brand identification, confirms the operation of Intel microprocessors, and does a stress test on the CPU. It checks the processor’s running frequency as well as its particular characteristics.
The program comes with three pre-configured settings: ‘Quick Test,’ which does a frequency test, ‘Functional Test,’ which performs stress testing for several minutes, and ‘Burn-in Test,’ which performs stress tests for two hours.
How to use the Intel Processor Diagnostic Tool?
Step 1:
We go to the Intel Processor Diagnostic Tool webpage to download the 64-bit or 32-bit program depending on the operating system version we’re running.
Step 2:
After successfully downloading and installing, launch the Intel Processor Diagnostic Tool by typing the Intel Processor Diagnostic Tool keyword into the search box and pressing Enter.
Step 3 :
The utility performs CPU tests once it is opened. The test progress meter will appear as seen below. Depending on the computer settings, this procedure might go fast or slowly, taking several minutes or even 30 minutes. Any tests that have been passed will have the word Pass, while any that are being tested will have the term Testing.
Step 4 :
The entire set of tests in the Results column and the ultimate result of whether the CPU is operating properly or not are the results of the CPU evaluation. A notification will be presented if the CPU encounters a problem, so the user is aware.
In addition, the System Info column on the Intel Processor Diagnostic Tool interface provides further configuration and hardware information.
9. UserBenchmark
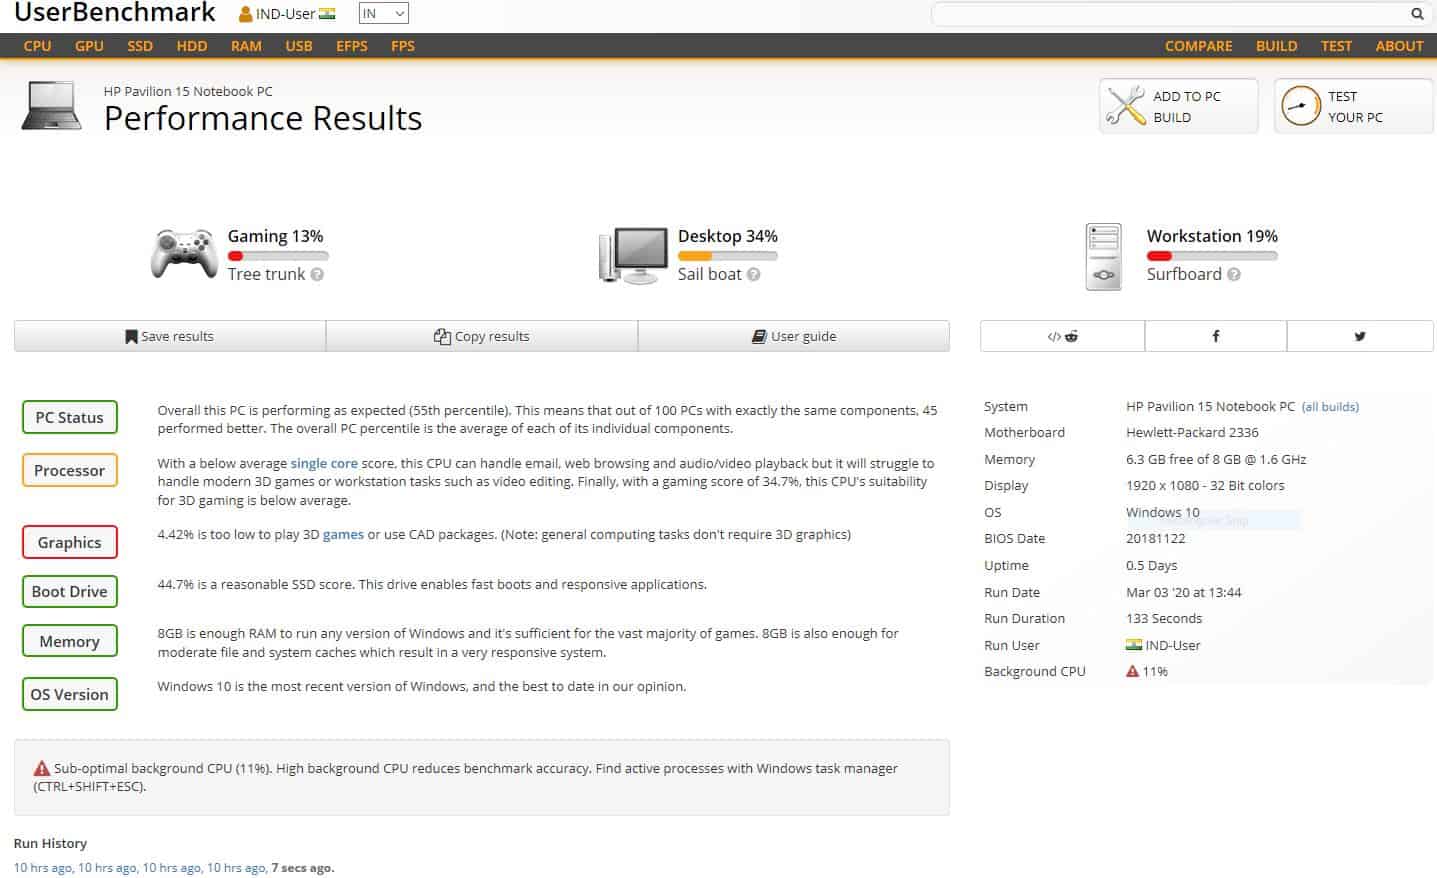
UserBenchmark runs a quick test on your PC and compares the results to other users that have the same subsystems. It’s one of the greatest free programs for swiftly detecting hardware problems and researching upgrade options.
The program examines four key system components: the CPU, RAM, GPU, and hard drive. It performs complicated computations on integers and floating values to test the CPU, and six 3D game simulations to test the GPU. For RAM testing, it does multiple read, write, and mixed IO activities, as well as multi-core bandwidth and latency.
10. PassMark BurnInTest
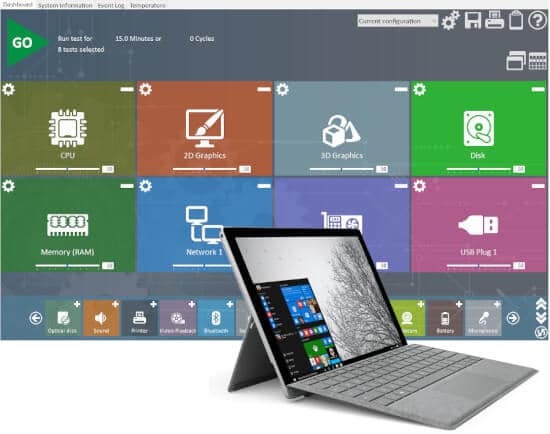
All of the key subsystems may be stress tested for durability, stability, and dependability with Passmark BurnInTest. It examines the CPU, GPU, RAM, SSDs, hard disc drives, optical drives, printers, network ports, and sound cards, among other components.
Additional tests, such as USB ports, cameras, microphones, and tape drives, are included in the professional edition. Its user interface displays the number of test cycles completed and the number of errors detected in each test, as well as warnings and comprehensive information.
PassMark BurnInTestTM is a software program that allows all of a computer’s key sub-systems to be stress-tested at the same time for endurance, dependability, and stability.
- Assists with PC diagnostics and troubleshooting.
- Delivering dead-on-arrival and defective gear to your clients is not a good idea.
- Simultaneous testing will drastically cut your test times.
- Develop a reputation as a provider of high-quality systems.
- Save money by avoiding downtime, system rebuilds, and data loss.
- After making configuration or hardware modifications, test the system’s stability (critical for overclocking and system upgrades).
- The hottest, most powerful CPU Burn In tool on the market! (Testing for heat).
Microphones, cameras, batteries, tape drives, USB ports (USB 3.0 and 2.0), Serial ports, and Parallel ports are all included in the Professional edition (with the use of loop back plugs).
You may create your own test and combine it with BurnInTest if you have specific hardware that BurnInTest does not test out of the box. PassMark, for example, has developed plugin tests for Touchscreens and Keyboards*.
Because the program is multithreaded, all of this can be done at the same time, making BurnInTest the quickest test available.
11. Heavyload
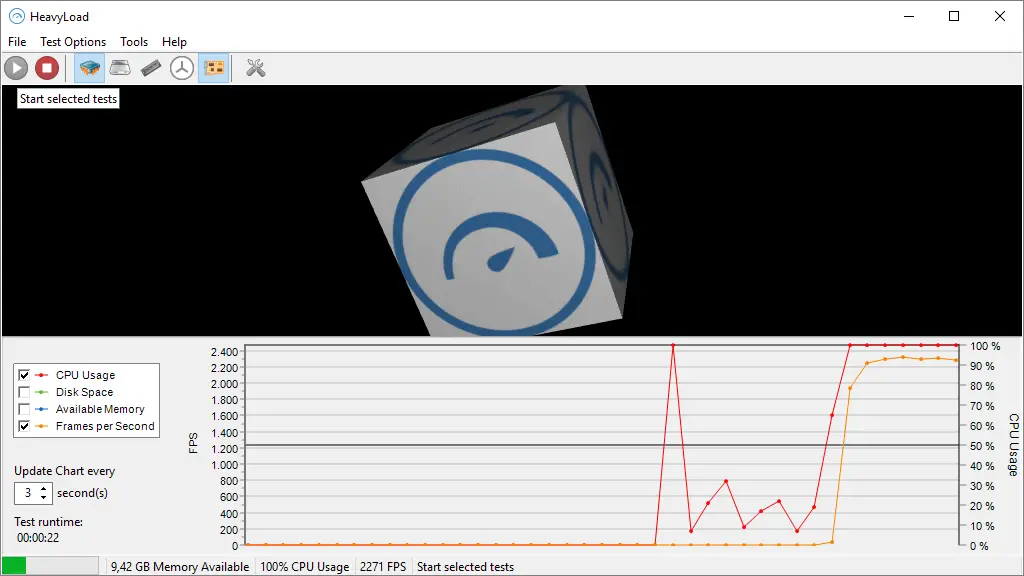
One of the most common programs for stress testing CPUs on Windows PCs is HeavyLoad. It’s a simple program that doesn’t have the same level of technical complexity as OCCT and the like, but it can do severe tests with a restricted range of capabilities. Simulated tasks are used to put the CPU through its paces and ensure its dependability. You may also create your own jobs, set a RAM limit, and choose certain cores to see how your system behaves in different circumstances. You may also set limits on disc space and write speed to see how your PC reacts when the hard drive exceeds its capacity.
It also includes a basic graph of CPU use on the dashboard for easy comprehension of performance information. So, if you’re searching for a simple tool to stress test your CPU, HeavyLoad is a good option.